Stock indices continue to slide on China growth worries and bank downgrades
Outlook on FTSE 100, DAX 40 and S&P 500 amid lacklustre China growth and possible downgrades of major banks by the ratings agency Fitch.
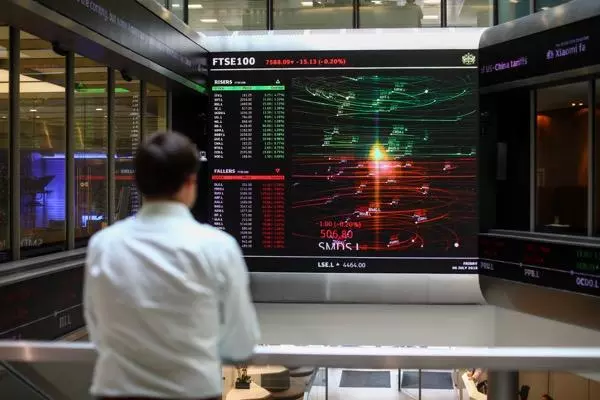

FTSE 100 slips despite UK inflation diminishing
Following on from Tuesday’s sharp falls, the FTSE 100 continues to slide despite UK inflation dropping to levels last seen in February 2022 and matching market consensus at 6.8% in July, driven by falling gas and electricity prices.
The UK blue-chip index is now trading in one-month lows and is fast approaching its 7,228 July trough. En route minor support may be found around the 10 July high at 7,307. Immediate resistance can be spotted at the 7,394 mid-July low and more significant resistance between the May and early August lows at 7,433 to 7,437.

DAX 40 remains under pressure
The DAX 40’s slide on China growth worries and possible downgrades of major banks by the ratings agency Fitch is ongoing with the index trading in one-month lows and flirting with the June trough at 15,710. The next lower early and late May lows at 15,659 to 15,625 may soon be reached but could offer support. If not, the July trough at 15,455 would be back in the frame.
Minor resistance can be found around the 4 August low at 15,780 and more important resistance along the July-to-August downtrend line at 15,912. While the index remains below the next higher 16,062 high seen last week, overall downside pressure should dominate.

S&P 500 drops to new one-month low
Worries about lacklustre China growth and major US investment banks such as JPMorgan possibly being downgraded by Fitch have pushed the S&P 500 to a new one-month low. The index also slipped through and closed below its March-to-August uptrend line at 4,450 and reached the 55-day simple moving average (SMA) at 4,439 which may offer short-term support.
If slipped through on a daily chart closing basis, however, the July low at 4,378 should be next in line. Resistance above the breached six-month uptrend line, now because of inverse polarity a resistance line, can be spotted between the June to July highs at 4,447 to 4,458. While no rise above the next higher 4,526 high - seen last week - occurs, the S&P 500 should retain its short-term bearish bias.

Related articles
Live prices on most popular markets
- Equities
- Indices
- Forex
- Commodities
Prices above are subject to our website terms and agreements. Prices are indicative only. All share prices are delayed by at least 15 minutes.
Prices above are subject to our website terms and agreements. Prices are indicative only. All shares prices are delayed by at least 15 mins.