EUR/USD, AUD/USD resume their descents while USD/JPY hits 34-year high
EUR/USD, AUD/USD resume their descents while USD/JPY hits 34-year high as the greenback appreciates across the board.


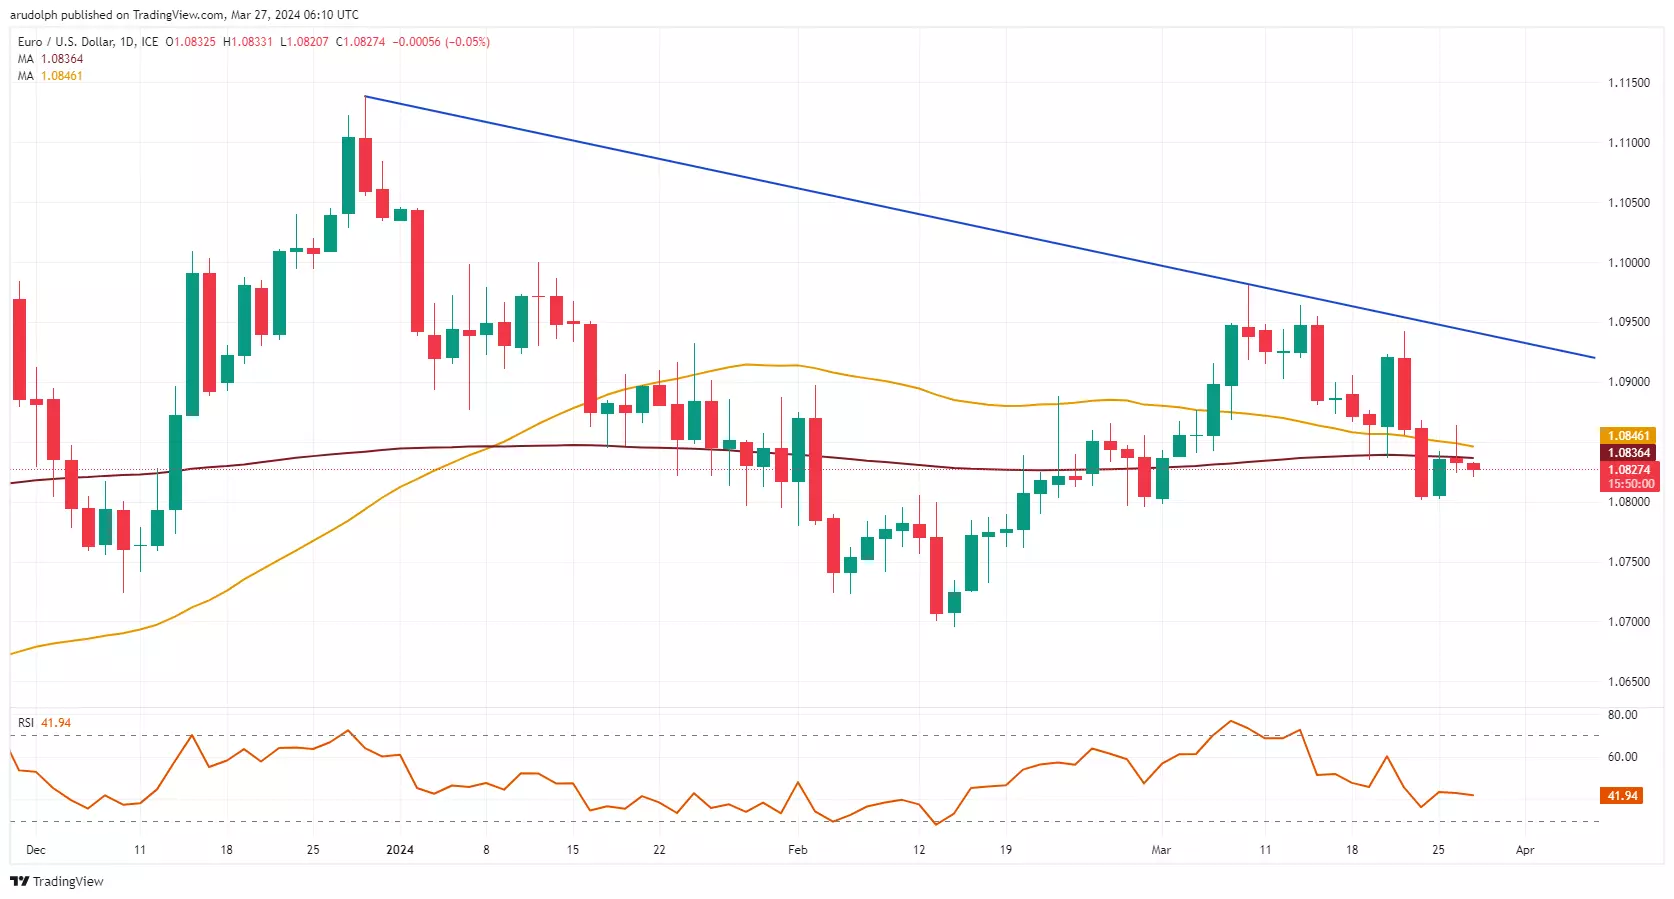
EUR/USD resumes its descent
EUR/USD is trading back below its 55-day simple moving averages (SMA) at $1.0846, following Tuesday's brief foray to $1.0864. Above it lies minor resistance at the early and late-February highs at $1.0888 to $1.0897.
Key short-term support sits between the late February and current March lows at $1.0802 to $1.0797, a fall through which would target the $1.0724 to $1.0695 region.
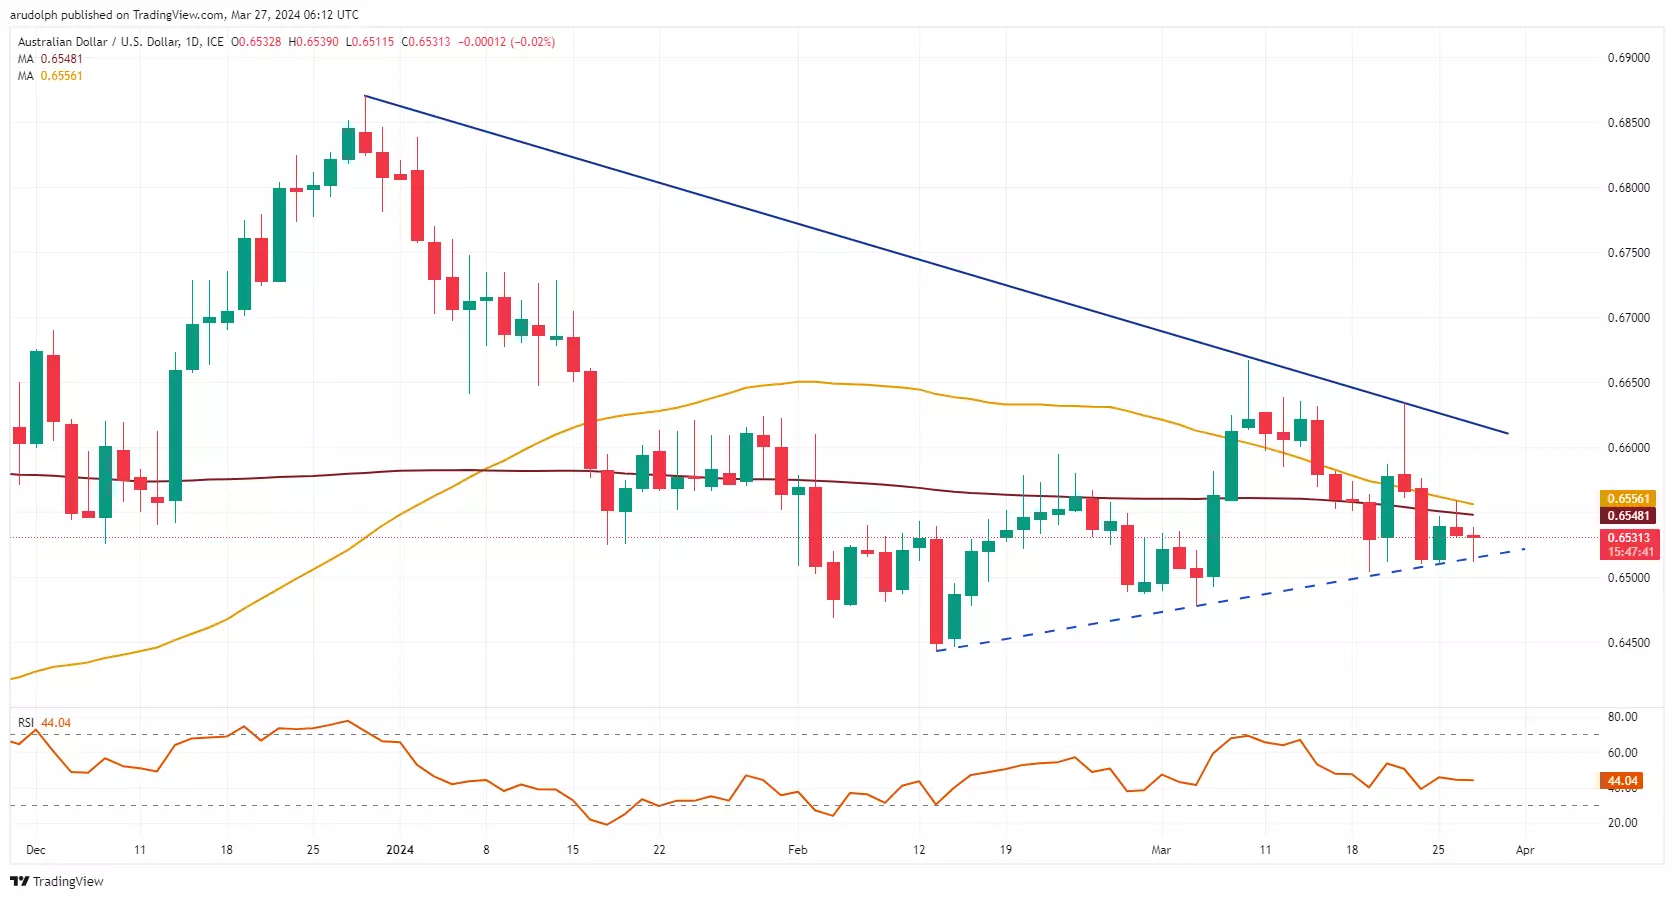
AUD/USD probes support
AUD/USD fell back to its February-to-March uptrend line, having been rejected by the 55-day SMA at $0.656 on Tuesday.
A fall through recent lows and last week's $0.6504 trough would put the February low at $0.6443 on the cards. This level will remain in focus as long as no bullish reversal takes the cross above last week's $0.6634 high.
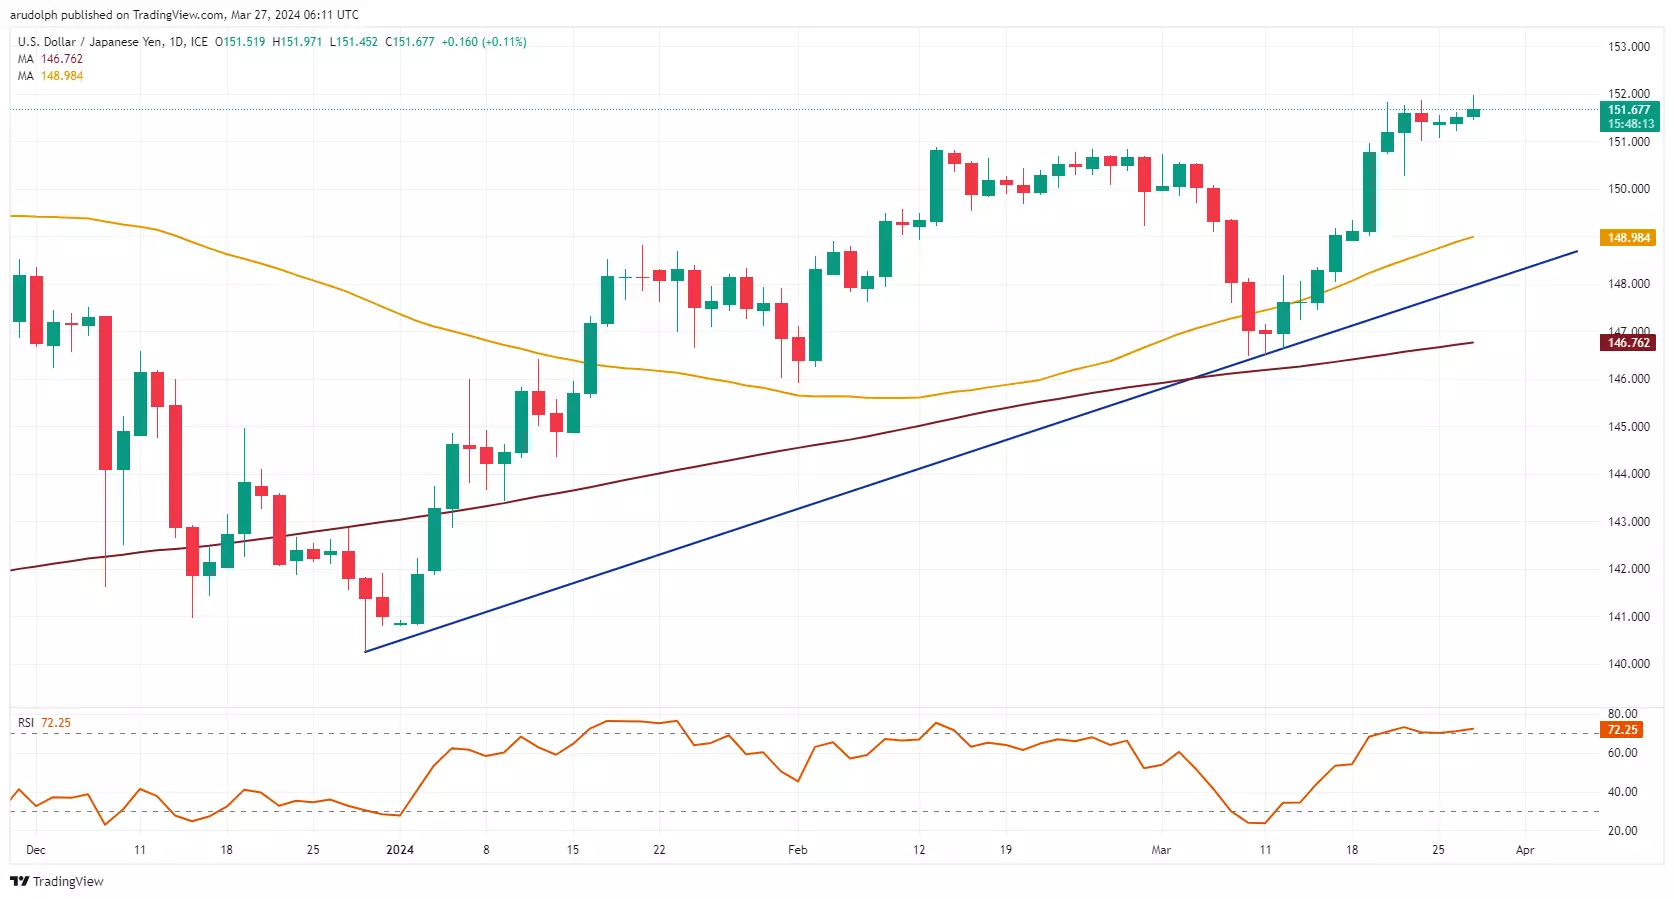
USD/JPY hits 34-year high
USD/JPY made a new 34-year high at ¥151.97, a rise above which and the ¥152.00 mark would engage the ¥153.60 July 1987 peak.
Minor support sits in the ¥150.88-83 region.
While last Thursday's ¥150.27 low underpins, an upside bias will remain in play.
This information has been prepared by IG, a trading name of IG Markets Limited. In addition to the disclaimer below, the material on this page does not contain a record of our trading prices, or an offer of, or solicitation for, a transaction in any financial instrument. IG accepts no responsibility for any use that may be made of these comments and for any consequences that result. No representation or warranty is given as to the accuracy or completeness of this information. Consequently any person acting on it does so entirely at their own risk. Any research provided does not have regard to the specific investment objectives, financial situation and needs of any specific person who may receive it. It has not been prepared in accordance with legal requirements designed to promote the independence of investment research and as such is considered to be a marketing communication. Although we are not specifically constrained from dealing ahead of our recommendations we do not seek to take advantage of them before they are provided to our clients. See full non-independent research disclaimer and quarterly summary.

Start trading forex today
Find opportunity on the world’s most-traded – and most-volatile – financial market.
- Trade spreads from just 0.6 points on EUR/USD
- Analyse with clear, fast charts
- Speculate wherever you are with our intuitive mobile apps
See an FX opportunity?
Try a risk-free trade in your demo account, and see whether you’re onto something.
- Log in to your demo
- Take your position
- See whether your hunch pays off
See an FX opportunity?
Don’t miss your chance – upgrade to a live account to take advantage.
- Get spreads from just 0.6 points on popular pairs
- Analyse and deal seamlessly on fast, intuitive charts
- See and react to breaking news in-platform
See an FX opportunity?
Don’t miss your chance. Log in to take your position.
Live prices on most popular markets
- Equities
- Indices
- Forex
- Commodities
Prices above are subject to our website terms and agreements. Prices are indicative only. All share prices are delayed by at least 15 minutes.
Prices above are subject to our website terms and agreements. Prices are indicative only. All shares prices are delayed by at least 15 mins.