Gold, oil and natural gas prices move higher
Commodity prices have made headway, with gold beginning to show signs of forming a higher low and oil prices pushing higher again.


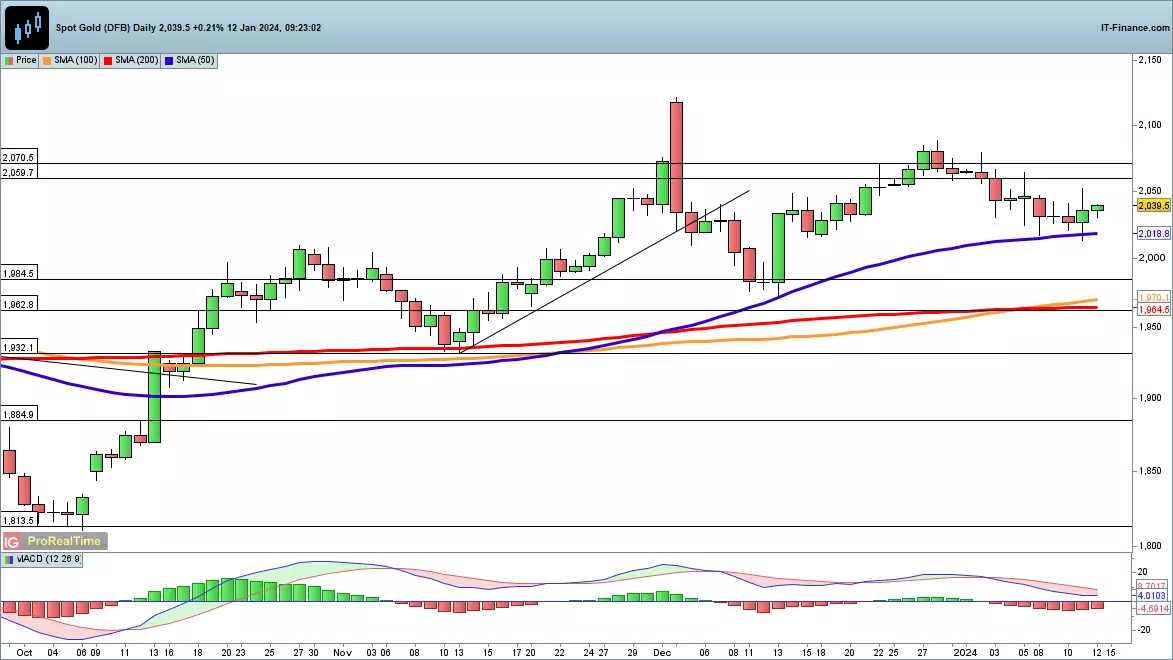
Gold starts to form higher low?
Gold prices have pushed higher for a second day, after testing the 50-day simple moving average (SMA) yesterday.
A higher low could be forming, which would help reinforce the uptrend and put the price back on course to the December highs.
A reversal below the 50-day SMA would be needed to put a more bearish view in place.
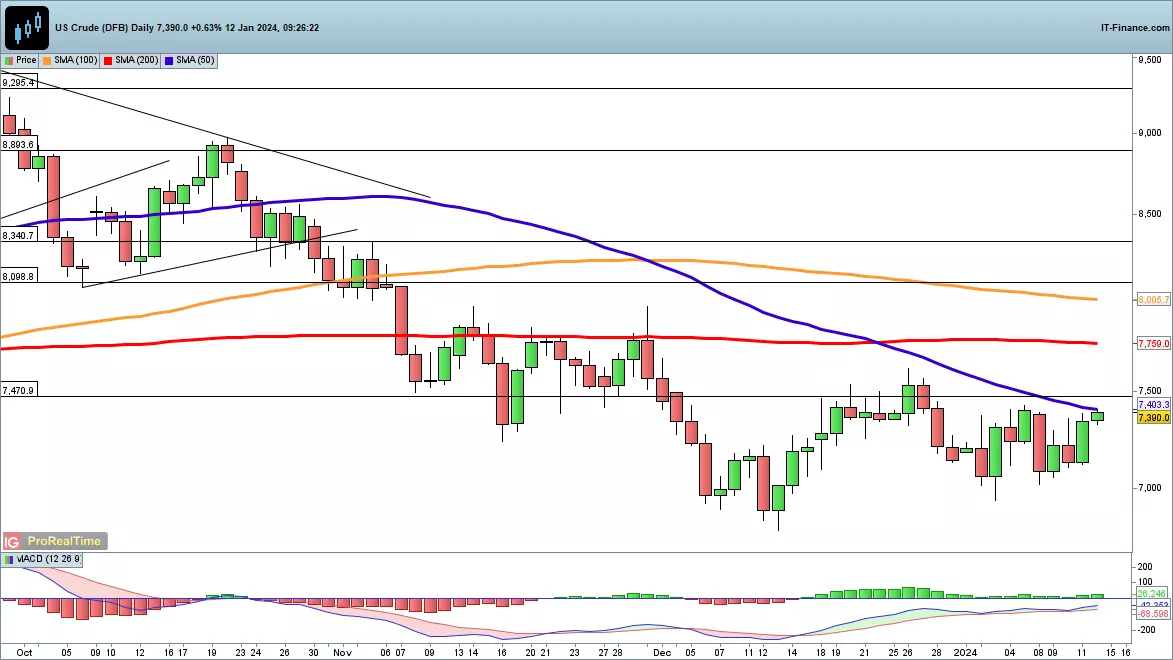
WTI rallies on Middle East tensions
Sharp gains yesterday came as US and UK forces began an attack on Houthi targets in Yemen in response to attacks on shipping in the Red Sea.
The price has continued to consolidate this week, holding above $70 as it has done throughout January. However, the 50-day SMA continues to cap gains. A close above the 50-day SMA is needed to put the price on course to challenge the December high at $76.20.
A drop back below $70 marks a more bearish development, breaking resistance and pointing towards additional downside.
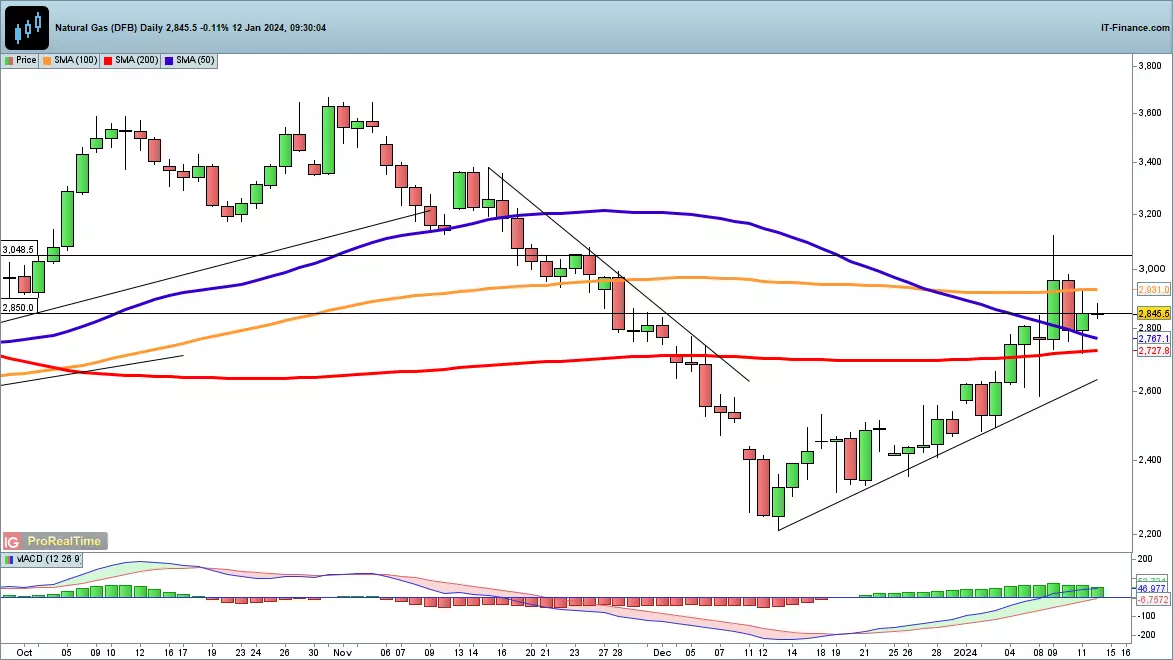
Natural Gas holds above 200-day moving average
A substantial rally off the December lows took a knock this week, though the overall bounce is still intact.
With the price now holding above the 200-day SMA, the next move may be a challenge of the 3000 level, which saw sellers emerge this week.
Beyond this the price heads on to 3200 and 3400, while rising trendline support from the December lows comes into view around 2700.
This information has been prepared by IG, a trading name of IG Markets Limited. In addition to the disclaimer below, the material on this page does not contain a record of our trading prices, or an offer of, or solicitation for, a transaction in any financial instrument. IG accepts no responsibility for any use that may be made of these comments and for any consequences that result. No representation or warranty is given as to the accuracy or completeness of this information. Consequently any person acting on it does so entirely at their own risk. Any research provided does not have regard to the specific investment objectives, financial situation and needs of any specific person who may receive it. It has not been prepared in accordance with legal requirements designed to promote the independence of investment research and as such is considered to be a marketing communication. Although we are not specifically constrained from dealing ahead of our recommendations we do not seek to take advantage of them before they are provided to our clients. See full non-independent research disclaimer and quarterly summary.
See your opportunity?
Seize it now. Trade over 15,000+ markets on our award-winning platform, with low spreads on indices, shares, commodities and more.
Live prices on most popular markets
- Equities
- Indices
- Forex
- Commodities
Prices above are subject to our website terms and agreements. Prices are indicative only. All share prices are delayed by at least 15 minutes.
Prices above are subject to our website terms and agreements. Prices are indicative only. All shares prices are delayed by at least 15 mins.