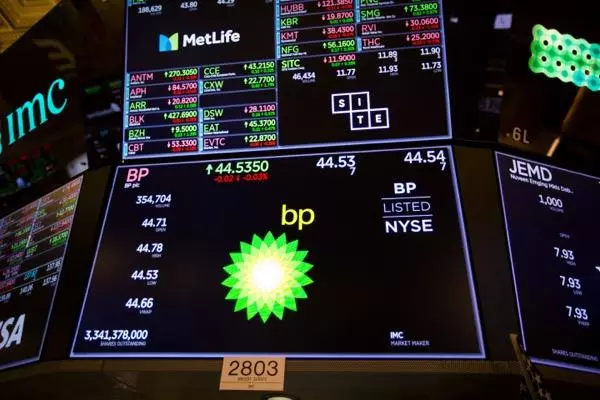
BP shares slide, could recent peak in earnings be turning point?
Replacement cost profits, the oil sector’s benchmark headline profit number, was $4.8 billion in the first quarter, down from $6.2bn last year, with oil prices having fallen from the peak seen after Russia's invasion of Ukraine.

While the company said the bottom line was driven by "exceptional" and "very strong" performances from its gas and oil trading operations, it left the quarterly dividend unchanged after raising it by 10 per cent in February.
It also cut back plans for share repurchases, announcing $1.75bn in buybacks to be completed in the next three months, down from the $2.75bn of buybacks it announced in the first quarter.
As IGTV’s Jeremy Naylor explains, the next headwind is likely to be politically driven with the Labour leader, Kier Starmer, pushing for further windfall tax levies on big oil.
(Video Transcript)
BP Q1 numbers
It's been another good quarter for another big oil giant - BP, this time around.
First quarter (Q1) figures coming in better than expected overall, but in fact, the shares were down. We'll take a look at shares in just a minute.
Let's take a look at the numbers as they came through. The profit attributable to shareholders came in at just shy of eight and a quarter billion dollars. Now, there had been a $20.3 billion loss this time last year. The replacement cost profits hitting just under $5 billion in the first three months of the year, although this was down from the $6.2 billion we saw this time last year, with oil prices having fallen back from the peak seen after Russia's invasion of Ukraine. Net debt falling to $21.2 billion, down from $27.4 billion this time last year.
The company said the numbers were driven by exceptional and very strong performances from its gas and oil trading operations.
Share price chart
Let's take a look at the share price because the stock, after having hit recent highs, up at 570 pence and it was, in fact, a good day at the back end of last week. Then after a long weekend, came this drop back. Today, we're now down 4.9%.
Now we're at a fairly interesting point in the markets for all this line here, down pretty much where we are at the low point today, which was the highs we saw back on the 3rd of November last year. So it is an interesting line of support at 504, if we do get a candle close below here you’re then on the way down to this 200-day moving average, the red line down here at 479. And if you're short on this, your stock goes just above where we are at the moment.
But I'm not so convinced necessarily this is going to end in any further major losses. And the big news, of course, is all about what's happening with the idea of the company paying more tax. And Keir Starmer has been on television once again this morning saying these big old companies need to be taxed more.
Now, that is going to be a headwind, there's no doubt about it. And there's the political will, I think, to force through this sort of taxation. But at the moment, at least, shares look quite happy just above the £5 level, currently trading at 509, down four and three quarter percent. today. Just to see where things trade in the next few days in the wake of these results out today.
This information has been prepared by IG, a trading name of IG Markets Limited. In addition to the disclaimer below, the material on this page does not contain a record of our trading prices, or an offer of, or solicitation for, a transaction in any financial instrument. IG accepts no responsibility for any use that may be made of these comments and for any consequences that result. No representation or warranty is given as to the accuracy or completeness of this information. Consequently any person acting on it does so entirely at their own risk. Any research provided does not have regard to the specific investment objectives, financial situation and needs of any specific person who may receive it. It has not been prepared in accordance with legal requirements designed to promote the independence of investment research and as such is considered to be a marketing communication. Although we are not specifically constrained from dealing ahead of our recommendations we do not seek to take advantage of them before they are provided to our clients. See full non-independent research disclaimer and quarterly summary.

Act on share opportunities today
Go long or short on thousands of international stocks with spread bets and CFDs.
- Get full exposure for a comparatively small deposit
- Trade on spreads from just 0.1%
- Get greater order book visibility with direct market access
See opportunity on a stock?
Try a risk-free trade in your demo account, and see whether you’re on to something.
- Log in to your demo
- Take your position
- See whether your hunch pays off
See opportunity on a stock?
Don’t miss your chance – upgrade to a live account to take advantage.
- Trade a huge range of popular stocks
- Analyse and deal seamlessly on fast, intuitive charts
- See and react to breaking news in-platform
See opportunity on a stock?
Don’t miss your chance. Log in to take advantage while conditions prevail.
Live prices on most popular markets
- Equities
- Indices
- Forex
- Commodities
Prices above are subject to our website terms and agreements. Prices are indicative only. All share prices are delayed by at least 15 minutes.
Prices above are subject to our website terms and agreements. Prices are indicative only. All shares prices are delayed by at least 15 mins.