EUR/USD and GBP/USD come off their five-month highs
Outlook on EUR/USD and GBP/USD as traders square their books ahead of year-end.

EUR/USD comes off five-month high
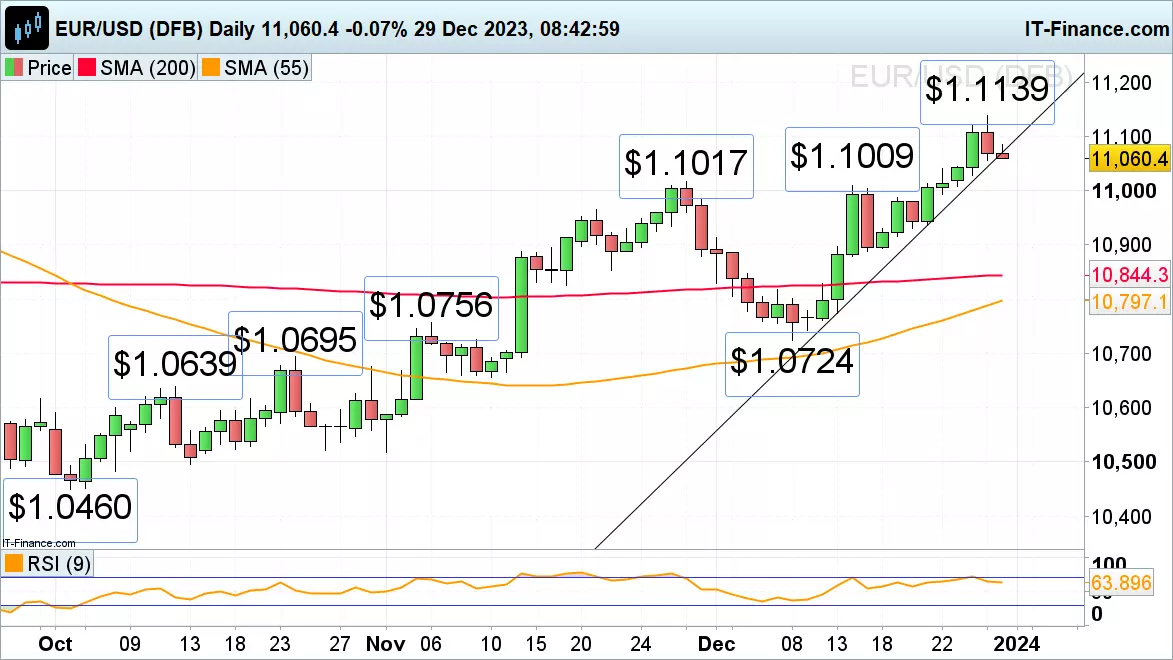
EUR/USD managed to rise to $1.1139, close to its 27 July high at $1.1149, before reversing lower amid an appreciating US dollar on short-covering into year-end.
The fall through the accelerated December uptrend line at $1.1070 puts the November peak at $1.1017 and the mid-December high at $1.1009 potentially back on the cards. This support area is likely to hold into year-end, though.
Above Friday’s intraday high at $1.1084 sits Wednesday’s $1.1122 high ahead of Thursday’s $1.1139 five-month high.
GBP/USD loses upside momentum into year-end
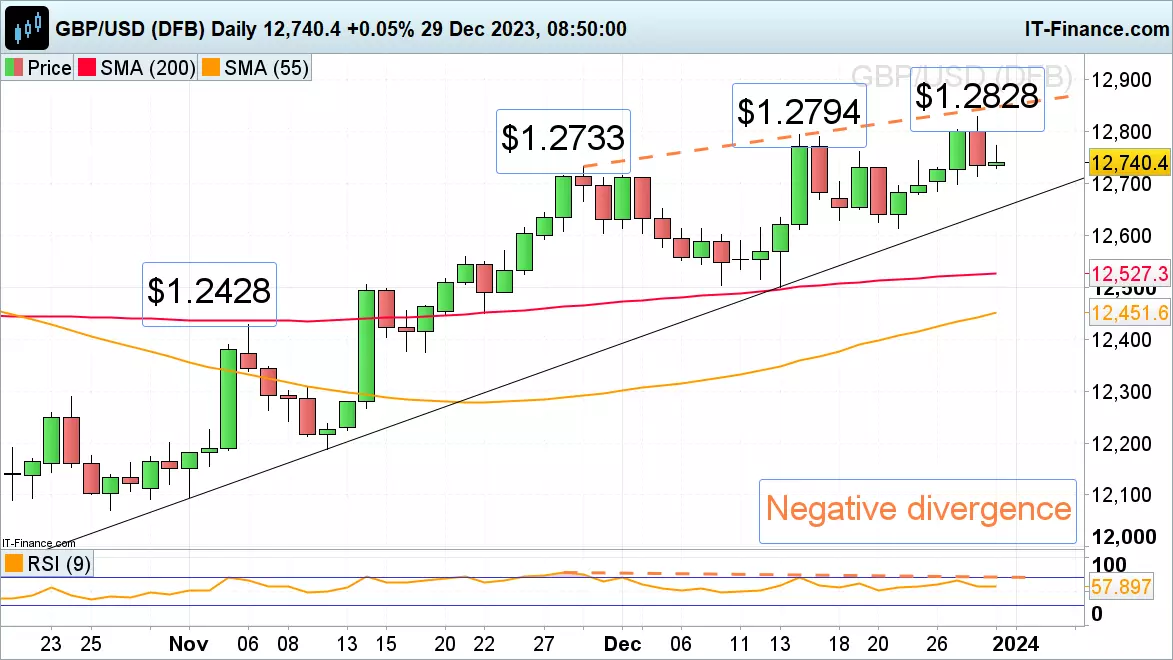
GBP/USD briefly made a new five-month high at $1.2828 on Thursday before giving back some of its gains as traders bought back their short US dollar positions.
Since negative divergence accompanied the daily Relative Strength Index (RSI), a possible top may be formed in the first week of 2024 which could take the currency pair through its November-to-December uptrend line at $1.2650. First, though, a fall through Thursday’s low at $1.2713 would need to occur.
Resistance remains to be seen at last week’s high at $1.2762 above which sits the more significant $1.2794 to $1.2828 resistance area which consists of the 10 August high at $1.2819 and the recent December peaks.
This information has been prepared by IG, a trading name of IG Markets Limited. In addition to the disclaimer below, the material on this page does not contain a record of our trading prices, or an offer of, or solicitation for, a transaction in any financial instrument. IG accepts no responsibility for any use that may be made of these comments and for any consequences that result. No representation or warranty is given as to the accuracy or completeness of this information. Consequently any person acting on it does so entirely at their own risk. Any research provided does not have regard to the specific investment objectives, financial situation and needs of any specific person who may receive it. It has not been prepared in accordance with legal requirements designed to promote the independence of investment research and as such is considered to be a marketing communication. Although we are not specifically constrained from dealing ahead of our recommendations we do not seek to take advantage of them before they are provided to our clients. See full non-independent research disclaimer and quarterly summary.

Start trading forex today
Find opportunity on the world’s most-traded – and most-volatile – financial market.
- Trade spreads from just 0.6 points on EUR/USD
- Analyse with clear, fast charts
- Speculate wherever you are with our intuitive mobile apps
See an FX opportunity?
Try a risk-free trade in your demo account, and see whether you’re onto something.
- Log in to your demo
- Take your position
- See whether your hunch pays off
See an FX opportunity?
Don’t miss your chance – upgrade to a live account to take advantage.
- Get spreads from just 0.6 points on popular pairs
- Analyse and deal seamlessly on fast, intuitive charts
- See and react to breaking news in-platform
See an FX opportunity?
Don’t miss your chance. Log in to take your position.
Live prices on most popular markets
- Equities
- Indices
- Forex
- Commodities
Prices above are subject to our website terms and agreements. Prices are indicative only. All share prices are delayed by at least 15 minutes.
Prices above are subject to our website terms and agreements. Prices are indicative only. All shares prices are delayed by at least 15 mins.