FTSE 100 lower as NatWest shares slide after a rise in debt provision
The problems consumers face here in the UK has been brought into sharp focus again today with another bank reporting an increase in bad debt provision.


NatWest says it took a provision of £247 million, while analysts had estimated this would be closer to £170mln.
On the bright side, interest earnings are up on the back of higher rates.
(Video Transcript)
NatWest under pressure
NatWest bank this morning came through with a similar sort of message we've seen from other UK banks this week that there's an increase in bad debt provisions because of the increased concerns around the consumer and household budgets.
The company came through with third quarter (Q3) figures. Let's take a look at the numbers that we saw from NatWest today.
Profit was down to £2.27 billion from £2.8 billion this time last year. So far as group pre-tax operating profits were £1.1 billion, up almost 20% year-over-year (YoY), but missing a consensus estimate of £1.2 billion.
So like rival Lloyds, NatWest is taking a larger than expected provision for future loan losses, which it said reflects the changes in its view of the British economy. The lender took provision to £247 million, above analyst estimates of £137 million and compared with £242 million on the release of the pandemic provisions in the same period last year.
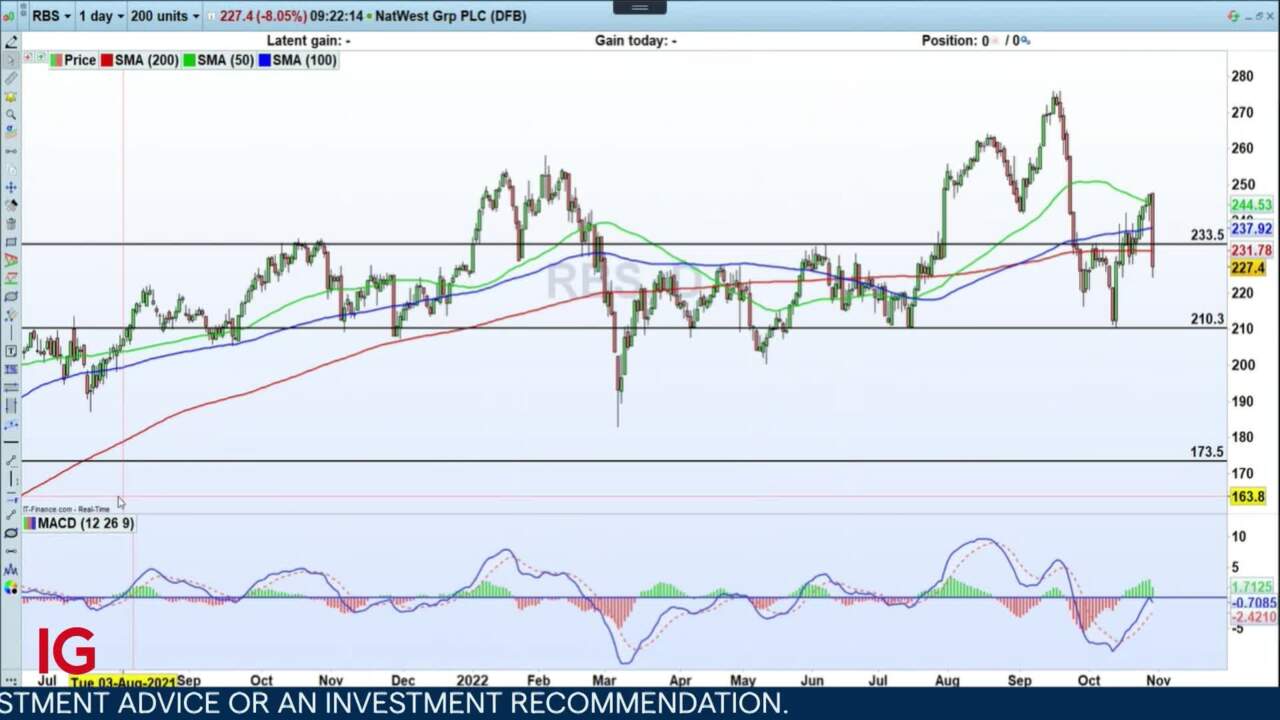
Share price chart
So whichever way you cut it, it was bad. And in fact you look at the share price chart you can see that despite this long-term chart that we go back here to July 2021 where we see a small updraft, you can quite clearly see the reaction today in the shares. So not too far off the lows that we saw early this morning. We're down 8% on the trading day after an hour and 20 minutes worth of the session so far today.
So the company clearly disappointing the markets but as I say the longer term picture remains where we've got gains and we're nowhere near the Covid losses that we had down at this line here at $0.97. Currently trading at 227.4 for NatWest group after its numbers out this morning for the third quarter.
This information has been prepared by IG, a trading name of IG Markets Limited. In addition to the disclaimer below, the material on this page does not contain a record of our trading prices, or an offer of, or solicitation for, a transaction in any financial instrument. IG accepts no responsibility for any use that may be made of these comments and for any consequences that result. No representation or warranty is given as to the accuracy or completeness of this information. Consequently any person acting on it does so entirely at their own risk. Any research provided does not have regard to the specific investment objectives, financial situation and needs of any specific person who may receive it. It has not been prepared in accordance with legal requirements designed to promote the independence of investment research and as such is considered to be a marketing communication. Although we are not specifically constrained from dealing ahead of our recommendations we do not seek to take advantage of them before they are provided to our clients. See full non-independent research disclaimer and quarterly summary.

Start trading forex today
Find opportunity on the world’s most-traded – and most-volatile – financial market.
- Trade spreads from just 0.6 points on EUR/USD
- Analyse with clear, fast charts
- Speculate wherever you are with our intuitive mobile apps
See an FX opportunity?
Try a risk-free trade in your demo account, and see whether you’re onto something.
- Log in to your demo
- Take your position
- See whether your hunch pays off
See an FX opportunity?
Don’t miss your chance – upgrade to a live account to take advantage.
- Get spreads from just 0.6 points on popular pairs
- Analyse and deal seamlessly on fast, intuitive charts
- See and react to breaking news in-platform
See an FX opportunity?
Don’t miss your chance. Log in to take your position.
Live prices on most popular markets
- Equities
- Indices
- Forex
- Commodities
Prices above are subject to our website terms and agreements. Prices are indicative only. All share prices are delayed by at least 15 minutes.
Prices above are subject to our website terms and agreements. Prices are indicative only. All shares prices are delayed by at least 15 mins.