Positive surprises in big tech earnings provided slight relief: Nasdaq 100, AUD/USD, EUR/USD
A lacklustre session in Wall Street overnight was met with some slight relief after-market, with positive surprises from Microsoft and Alphabet’s results.


Market Recap
A lacklustre session in Wall Street (DJIA -1.02%; S&P 500 -1.58%; Nasdaq -1.98%) overnight was met with some slight relief after-market, as positive surprises from Microsoft and Alphabet’s results aided to set a less negative tone for risk sentiments. Both tech giants smashed top and bottom-line expectations, reflecting some resilience amid the downbeat environment, which may drive some hopes for upcoming big tech companies to outperform as well.
A better-than-expected quarterly guidance was also delivered from Microsoft, while Alphabet’s advertising revenue has held up surprisingly well amid the broad-based pullback in ad spending. This marks the first quarterly top and bottom-line beat from Alphabet after four quarters of underperformance. The results have sent Microsoft and Alphabet’s share price up 8% and 2% respectively.
Nevertheless, the gains in US equity futures this morning still trail the overnight losses for now, as lingering economic concerns and uncertainties around any spillovers from First Republic Bank (FRC) continue to be something for the bulls to deal with. Economic data yesterday revealed a sharper-than-expected moderation in consumer confidence (101.3 versus 104 forecast), which adds to the list of downside surprises seen since the start of April and points to a more downbeat economic outlook.
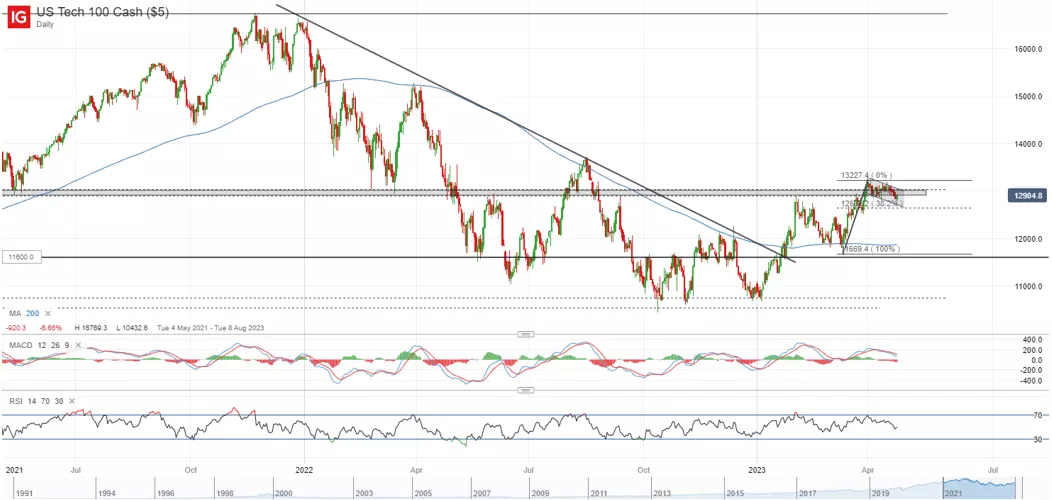
For the Nasdaq 100, it continues to edge within a bull flag formation for now. General convention is that the retracement may reach the 38.2% Fibonacci level before breaking the upper trend line, which may leave the 12,700 level on watch for any holding up. Another move back to retest its 2023 high will provide greater conviction for the bulls, which puts the formation of any new higher high on the radar.
Asia Open
Asian stocks look set for a mixed open, with Nikkei -0.33%, ASX -0.40% and KOSPI +0.12% at the time of writing, as sentiments struggled to balance between the negative handover from Wall Street, and the attempt for recovery after-market on Microsoft and Alphabet’s results.
On the economic front, the Reserve Bank of Australia (RBA) trimmed mean quarter one (Q1) CPI came in lower than expected (1.2% quarter-on-quarter (QoQ) versus 1.4% forecast) but headline continues to reveal some persistence (1.4% QoQ versus 1.3% expected). This could provide an overall mixed view, but the lack of a broad-based upside surprise in inflation could still be tapped on for more wait-and-see from the central bank. Expectations remain anchored for a rate pause at the upcoming meeting.
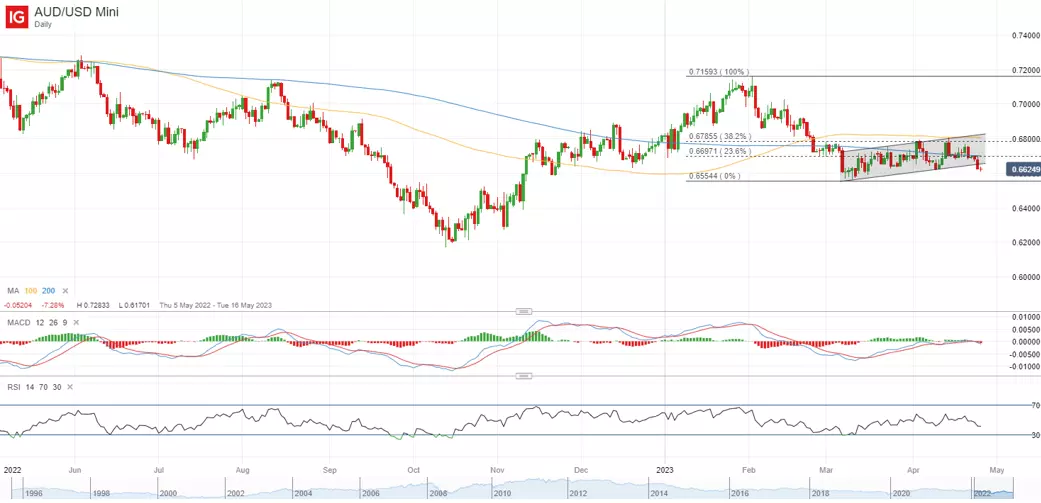
For the AUD/USD, the pair has struggled to reclaim its key 100-day moving average (MA) upon multiple retests, with the bears seeking to overturn the higher lows narrative displayed since March this year. Upward momentum has stalled recently, with greater conviction for the bulls to be a move back above its 100-day MA to denote a shift in trend. The MA line has shown to be a key resistance line by capping the pair on three separate occasions this year.
On the watchlist: EUR/USD still attempting for a break of key resistance
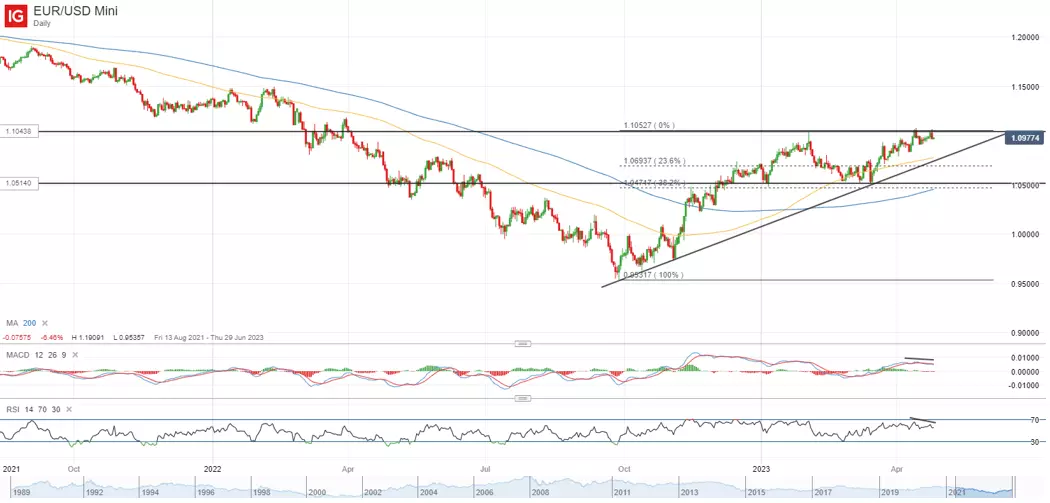
The EUR/USD is back to retest its 2023 high at the 1.105 level this week, where an upward break could point to the formation of a new higher high and further reiterates its overall bullish trend. A defensive lean in market sentiments is keeping a breakout in check for now, along with some moderating upward momentum, but a series of support remain on watch to hold up the pair in the event of a retracement. This includes an upward trendline support and its 100-day MA.
Monetary policy divergence between the European Central Bank (ECB) and the Federal Reserve (Fed) will remain the key driving force for the pair over the coming months. Expectations remain well-anchored for an impending rate pause from the Fed, while on the other end, the ECB is expected to stay on its hawkish path to tackle persistent core prices, with any such confirmation likely to translate into EUR/USD strength.
Tuesday: DJIA -1.02%; S&P 500 -1.58%; Nasdaq -1.98%, DAX +0.05%, FTSE -0.27%
This information has been prepared by IG, a trading name of IG Markets Limited. In addition to the disclaimer below, the material on this page does not contain a record of our trading prices, or an offer of, or solicitation for, a transaction in any financial instrument. IG accepts no responsibility for any use that may be made of these comments and for any consequences that result. No representation or warranty is given as to the accuracy or completeness of this information. Consequently any person acting on it does so entirely at their own risk. Any research provided does not have regard to the specific investment objectives, financial situation and needs of any specific person who may receive it. It has not been prepared in accordance with legal requirements designed to promote the independence of investment research and as such is considered to be a marketing communication. Although we are not specifically constrained from dealing ahead of our recommendations we do not seek to take advantage of them before they are provided to our clients. See full non-independent research disclaimer and quarterly summary.

Act on share opportunities today
Go long or short on thousands of international stocks with spread bets and CFDs.
- Get full exposure for a comparatively small deposit
- Trade on spreads from just 0.1%
- Get greater order book visibility with direct market access
See opportunity on a stock?
Try a risk-free trade in your demo account, and see whether you’re on to something.
- Log in to your demo
- Take your position
- See whether your hunch pays off
See opportunity on a stock?
Don’t miss your chance – upgrade to a live account to take advantage.
- Trade a huge range of popular stocks
- Analyse and deal seamlessly on fast, intuitive charts
- See and react to breaking news in-platform
See opportunity on a stock?
Don’t miss your chance. Log in to take advantage while conditions prevail.
Live prices on most popular markets
- Equities
- Indices
- Forex
- Commodities
Prices above are subject to our website terms and agreements. Prices are indicative only. All share prices are delayed by at least 15 minutes.
Prices above are subject to our website terms and agreements. Prices are indicative only. All shares prices are delayed by at least 15 mins.